Undergraduate Research at Jefferson Lab
Where to Plot Your Ratios: A Bin-Centering Analysis
Student: Matthew Knauss
School: Duquesne University
Mentored By: Douglas Higinbotham
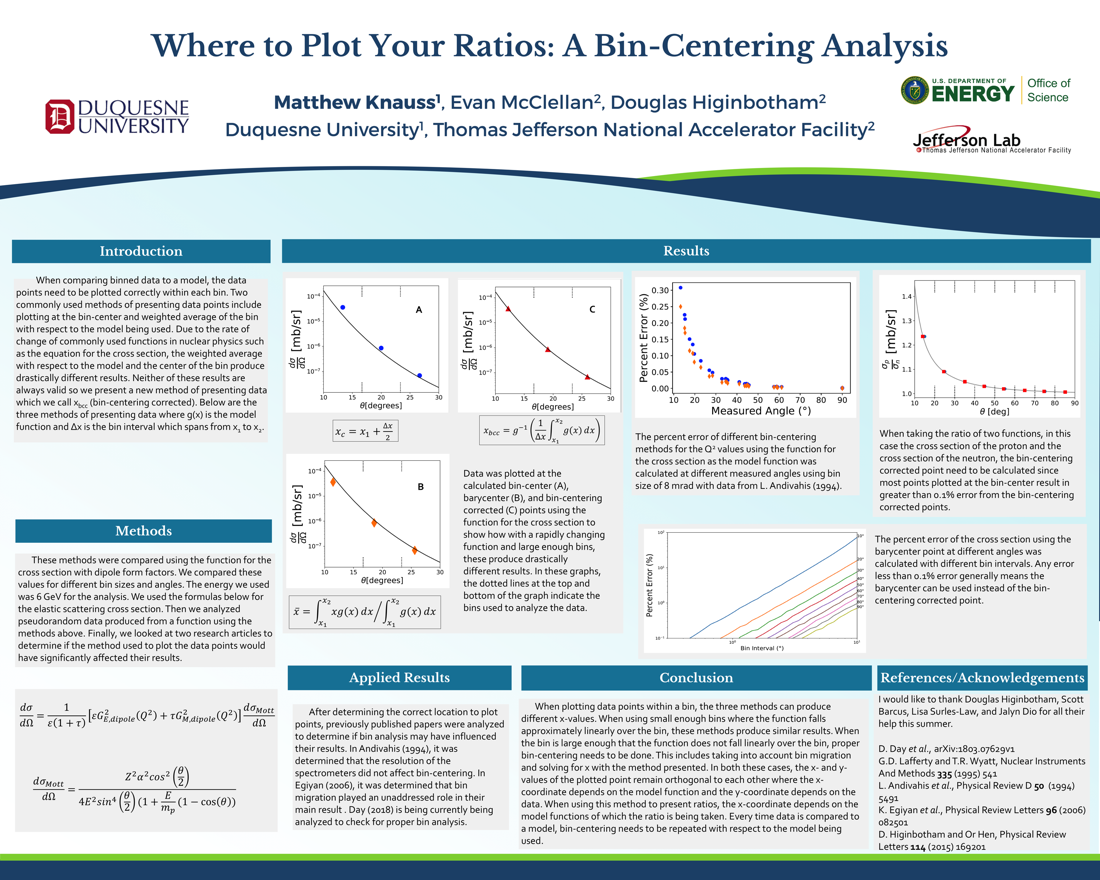
To compare data collected in bins to models, the data points need to be plotted correctly within each bin. Two common methods for presenting data points are to plot the points at the bin center or to plot at the weighted average of the bin with respect to the model being used. In nuclear physics, the equation for the cross section falls faster than an exponential and the above methods of bin-centering produce drastically different results. When plotting binned data points to compare with models, the aforementioned techniques produce different bin centering, neither of which are always valid. These methods along with a new method of bin-centering were analyzed with respect to the equation for the elastic cross-section. It is shown that when the bin size is small enough that the function falls approximately linearly over the bin, the above methods result in similar values. However, when the bin size is large enough that the function does not fall linearly over the bin, proper bin-centering needs to be done. When bin-centering with this new method, the x- and y-values of the point being plotted remain orthogonal, where the x-value depends on the model function being used and the y-value depends on the data collected. For large width bins, every time data is compared to a model, bin-centering needs to be repeated with respect to the model being used.
Citation and linking information
For questions about this page, please contact Education Web Administrator.